 Crow Flow
Hierarchy Flow Visualiser Interactive graph editor for hierarchical structures and directional flows
The Hierarchy Flow Visualiser (Crow Flow) is a browser-based, interactive tool for building and exploring hierarchical node structures connected by animated directional flows. Define your graph using a simple text-based DSL, then pan, zoom, expand, collapse, and rearrange everything on a live canvas.
Quick Start
Get up and running in under a minute:
- Open the app in any modern browser — no build step or dependencies required.
- Click ✏️ Edit Graph in the toolbar to open the DSL editor.
- Type your graph definition using the syntax described below.
- Click Save & Apply — your graph renders instantly on the canvas.
Here's a minimal example to get started:
# Define hierarchy: A and B are children of Container
A & B > Container

# Define a flow from A through B to an external node
F1= A --> B --> External

# Add attributes to nodes
A{status=live, label="Service A"}
B{status=inprogress}
DSL Syntax
The graph is defined using a lightweight text-based Domain-Specific Language (DSL). The DSL has three line types: hierarchy lines, flow lines, and attribute lines. Lines are processed top-to-bottom. Blank lines and whitespace are ignored.
| Line Type | Syntax Pattern | Example |
|---|---|---|
| Hierarchy | child > parent |
A & B > C |
| Flow | ID= source --> target |
F1= A --> D |
| Attribute | ID{key=value} |
A{status=live} |
MyNode and mynode refer to the same node.
Nodes are created automatically when first referenced in any line.
Hierarchy Lines
Hierarchy lines define parent–child relationships between nodes using the > operator.
The left side contains one or more child nodes (separated by &), and the right side
is the parent node.
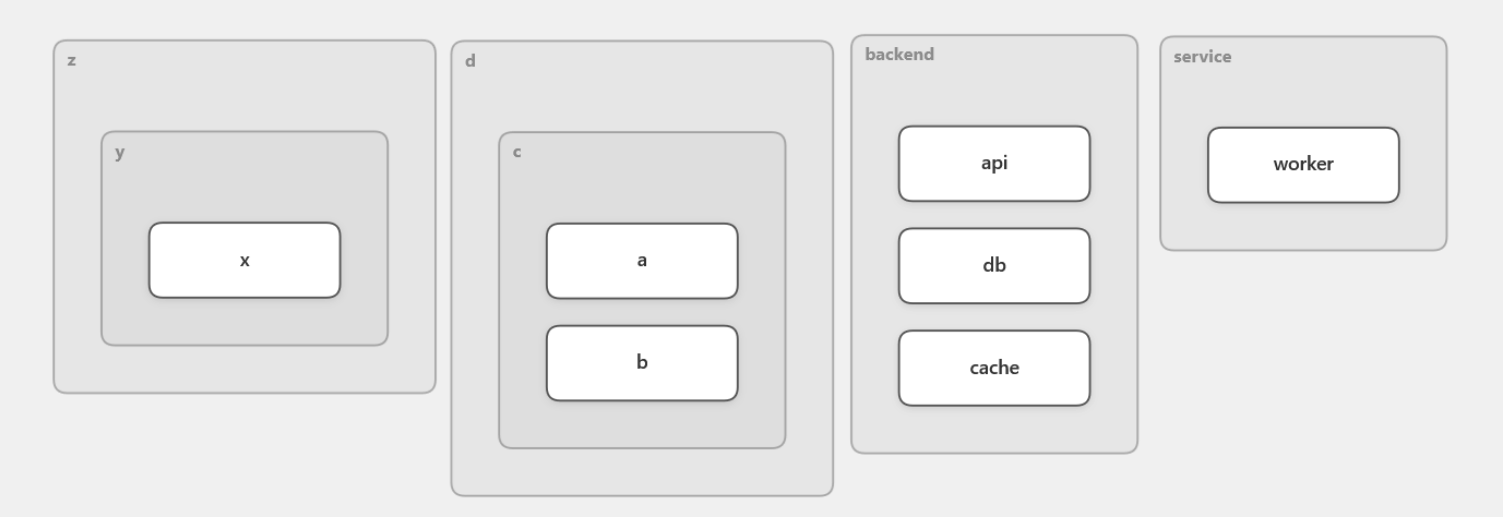
# Single child inside a parent
Worker > Service

# Multiple children inside a parent (use & to separate)
API & DB & Cache > Backend

# Chained nesting: A & B inside C, and C inside D
A & B > C
C > D

# Multi-level in one line: X inside Y inside Z
X > Y > Z
Flow Lines
Flow lines define directional connections between nodes using the --> arrow operator.
Flows are rendered as thick, animated Sankey-style ribbons on the canvas.
# Simple flow: A connects to B
F1= A --> B

# Chained flow: A to B to C to D
Pipeline= Source --> Transform --> Load --> Sink

# Multi-source: A and B both flow into C
Merge= A & B --> C

# Multi-target: A flows to both B and C
Split= A --> B & C
Attribute Lines
Attributes are key-value pairs attached to nodes or flows. They are used for labelling, styling (status/color),
and storing arbitrary metadata. Attributes are defined using curly braces {} after a node or flow ID.
# Node attributes
api{status=live, label="API Gateway", owner="team-alpha"}

# Flow attributes
F1{mode=batch, label="Daily ETL"}

# Custom color (hex without #)
alerts{color=ff6b6b, label="Alert Service"}

# Values with spaces must be quoted
db{label="Main Database", type=postgres}
| Attribute | Applies To | Description |
|---|---|---|
label |
Node, Flow | Display label. Shown on the node or above the flow ribbon. |
name |
Node, Flow | Alternative to label. Used as display name if label is not set. |
status |
Node, Flow | Automatic coloring: live, inprogress, tostart. |
color |
Node, Flow | Custom hex color (without #). Overrides status color. |
mode |
Flow | Animation mode: batch for block animation, stream for streaming. (defaults to streaming) |
| any key | Node, Flow | Arbitrary metadata — visible and editable in the Properties panel. |
Inline Flow Attributes
Flow attributes can be defined inline on the flow definition line, between the ID and the = sign.
This is the most common way to define flow attributes.
# Inline attributes on a named flow
ETL{mode=batch, label="Nightly ETL"}= Source --> Transform --> Warehouse

# Inline attributes on an anonymous flow (use _ as ID)
_{name="events", mode=batch}= Producer --> Queue --> Consumer

# Status-colored flow
DataSync{status=live}= Primary --> Replica
Anonymous Flows
Flows don't require an explicit ID. You can use _ as the ID for anonymous flows, or omit the
ID= prefix entirely for quick connections.
# Anonymous flow with underscore prefix
_= A --> B

# Fully anonymous — no ID or = needed
X --> Y --> Z

# Anonymous with inline attributes
_{mode=batch}= Upstream --> Downstream
flow_0, flow_1, etc.) so they remain individually identifiable in the Properties panel.
Multi-Path & Branching Flows
A single flow definition can describe multiple paths using & for branching
and commas for separate path segments.
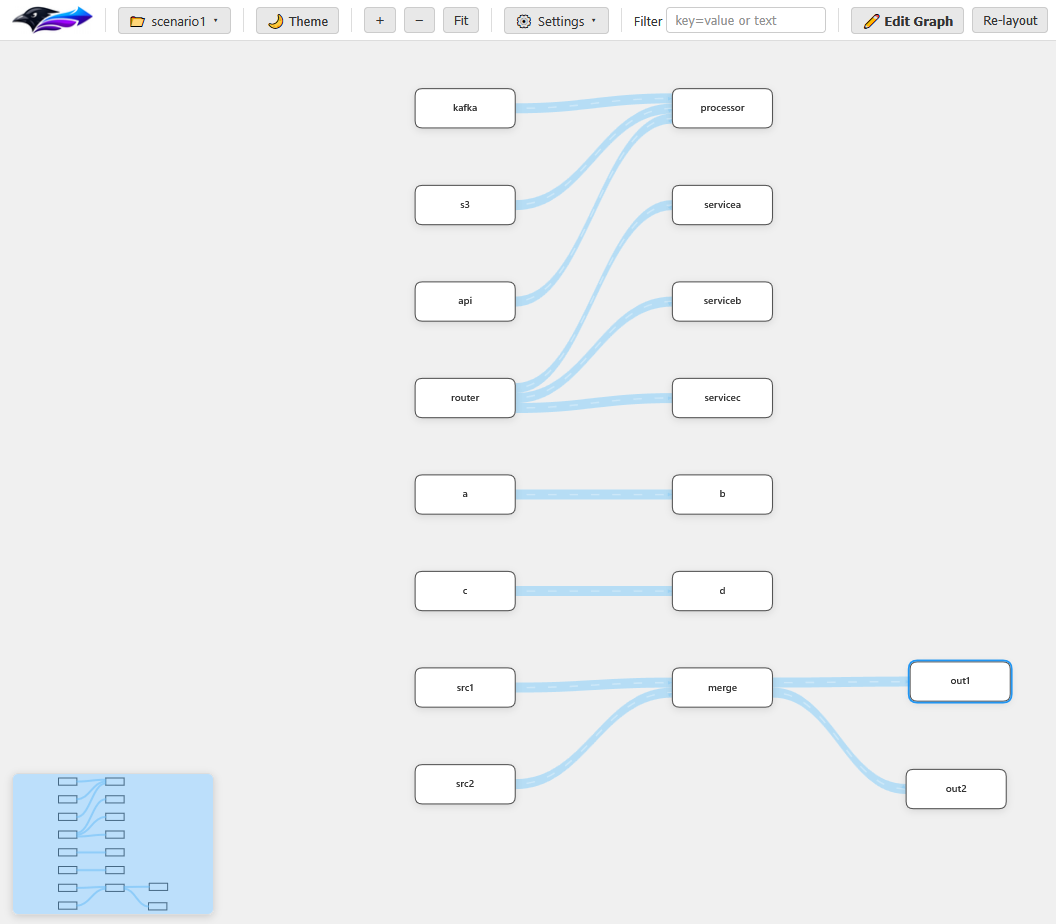
# Fan-in: multiple sources merge into one target
Ingest= Kafka & S3 & API --> Processor

# Fan-out: one source splits into multiple targets
Fanout= Router --> ServiceA & ServiceB & ServiceC

# Comma-separated paths (multiple independent segments in one flow)
Mixed= A --> B, C --> D

# Complex: chain + fan-in + fan-out in a single flow
Pipeline= Src1 & Src2 --> Merge --> Out1 & Out2
Canvas Interaction
The canvas is fully interactive. You can pan, zoom, select, and drag elements freely using mouse and keyboard controls.
| Action | Input | Description |
|---|---|---|
| Pan | Click + drag empty space | Move the viewport around the canvas |
| Zoom | Mouse wheel | Zoom in/out centered on cursor |
| Zoom In | Toolbar + | Zoom in from center |
| Zoom Out | Toolbar − | Zoom out from center |
| Fit to View | Toolbar Fit | Zoom and pan to show the entire graph |
| Select Node | Click a node | Select a node and open its properties |
| Select Flow | Click a flow ribbon | Select a flow and open its properties |
| Multi-Select | Ctrl + Click | Add/remove items from the selection |
| Move Node | Click + drag a node | Reposition a node (and its children if expanded) |
| Expand/Collapse | Double-click a container | Toggle visibility of child nodes |
| Deselect | Esc | Clear the current selection |
Expand & Collapse
Nodes that contain children (defined via hierarchy lines) are container nodes. Initially,
all containers are collapsed — showing as a regular node with a small ▶ indicator.
- Double-click a container node to expand it. Children are laid out inside the parent boundary.
- Double-click an expanded container to collapse it back down.
- Child positions are preserved when collapsing — re-expanding restores the same layout.
- Expanding a node automatically shifts adjacent nodes to avoid overlapping.
- Use Collapse All in the toolbar to collapse every expanded container at once.
# Create a two-level hierarchy
Worker1 & Worker2 > Pool
Pool & Scheduler > Backend

# Flows between nested nodes
Work= Scheduler --> Worker1 & Worker2
Flow Animation
Flows animate with moving dashes to indicate direction of data/control travel. The animation style depends
on the flow's mode attribute:
- Stream mode (default) — small dashes move along the center of the ribbon.
- Batch mode (
mode=batch) — wide block segments move along the ribbon, visually representing chunks of data.
# Default streaming flow
Realtime= Events --> Processor --> Dashboard

# Batch flow with block animation
ETL{mode=batch}= Database --> ETL --> Warehouse
Animation speed is configurable through the Settings dropdown in the toolbar.
Set speed to 0 to pause all animation.
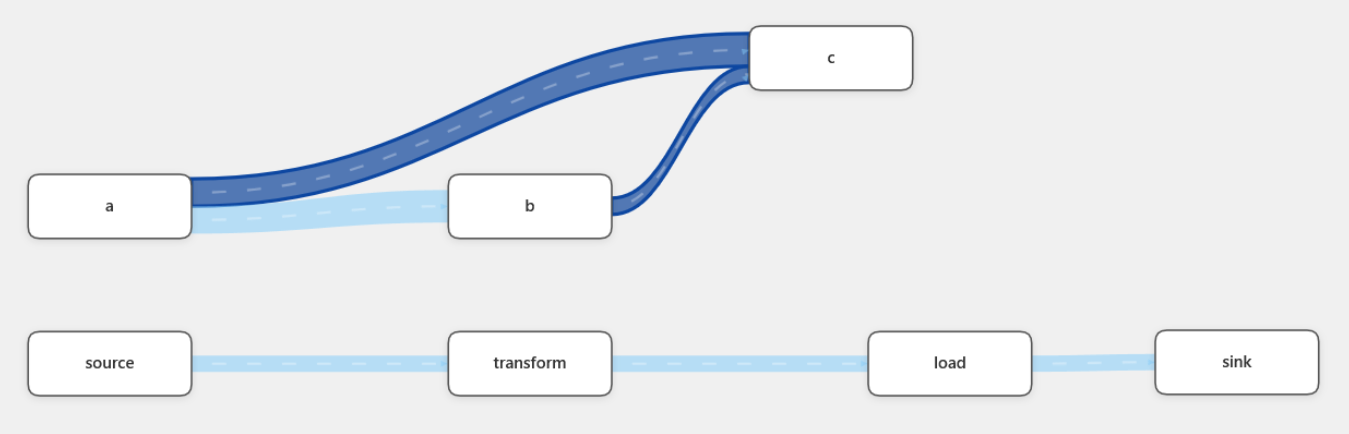
Flow Merging
When multiple flows share the same visual endpoints (e.g. because their actual endpoints are children of the same collapsed container), they are merged into a single thicker ribbon. The ribbon thickness scales with the number of merged flows.
Flows with different colors or modes remain separate ribbons even when sharing the same endpoints. Expanding the container separates the flows to show their actual individual connections.
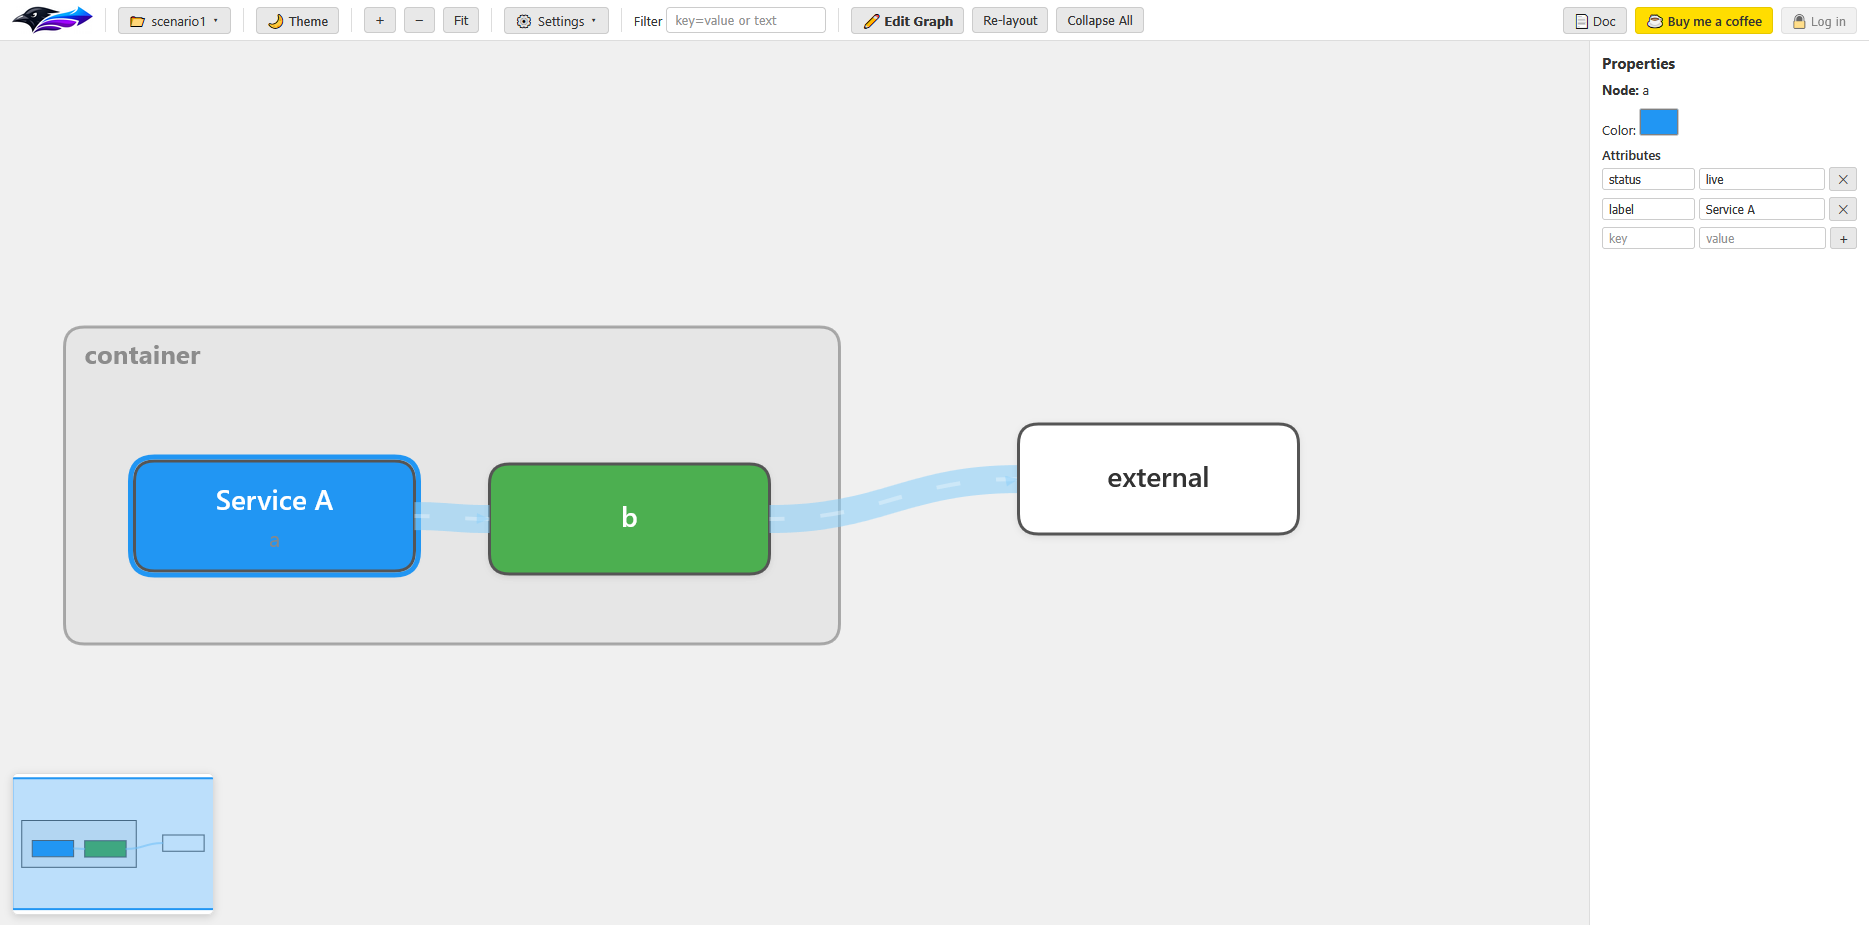
Attributes Panel
The right-hand Properties panel displays attributes of the currently selected node or flow. From this panel you can:
- View all attributes as key-value pairs.
- Edit any attribute value inline.
- Add new attributes using the
+button. - Remove attributes using the
✕button. - Change colors via the color picker.
Changes made in the Properties panel are automatically reflected in the DSL and persisted with your current scenario.
Status Colors
Setting the status attribute on a node or flow applies automatic color coding.
The following status values are recognized:
| Status | Node Color | Flow Color | Visual |
|---|---|---|---|
live |
Blue (#2196F3) | Green (#4CAF50) | Active / running |
inprogress |
Green (#4CAF50) | Yellow (#FFD54F) | Being built / deployed |
tostart |
Amber (#FFC107) | Tan (#C8A96E) | Planned / not yet started |
# Color flows by status
_{status=live}= api --> existingfeature
_{status=inprogress}= api --> featureindev
_{status=tostart}= api --> futurefeature
Custom Colors
You can assign any hex color to a node or flow using the color attribute (without the # prefix).
Custom colors override status colors.
# Red node
Alerts{color=ff6b6b}

# Purple flow
Events{color=9b59b6}= Producer --> Consumer

# Teal container
Infra{color=00bcd4, label="Infrastructure"}
Filtering
The Filter field in the toolbar lets you search and highlight nodes and flows by their attributes, IDs, or labels. Non-matching items are dimmed, making it easy to focus on specific parts of the graph.
The filter matches against:
- Node and flow IDs
- Attribute keys and values (e.g.
status=live) - Labels/names (
labelandnameattributes)
# Show only live items
status=live

# Filter by a label substring
gateway

# Filter by node ID
api

# Filter by any attribute value
team-alpha
Highlight Connections
Enable Highlight Connections in the Settings dropdown, then click any node. All upstream and downstream connected nodes and flows are highlighted, while unrelated items are dimmed. This provides a quick view of data lineage and dependencies.
- Traverses the full flow graph in both directions (upstream and downstream).
- Works with multi-select — highlight connections for multiple selected nodes simultaneously.
- Parent containers of highlighted nodes are also highlighted.
Scenarios
Scenarios let you maintain multiple independent graph configurations. Each scenario stores
its own DSL text and node positions. Scenarios are persisted in browser localStorage and survive
page reloads.
Scenario actions (available in the Scenario dropdown in the toolbar):
| Action | Description |
|---|---|
| + New | Create a new empty scenario with a custom name. |
| ✏️ Edit | Rename the current scenario. |
| ⧉ Dup | Duplicate the current scenario (DSL + positions) with "(copy)" suffix. |
| 🗑️ Del | Delete the current scenario (at least one must remain). |
| Switch | Select a different scenario from the dropdown. |
Light & Dark Theme
Toggle between light and dark color schemes using the 🌙 Theme / ☀️ Theme button in the toolbar. The theme affects the entire UI including the canvas background, nodes, flows, toolbar, panels, and minimap.
Minimap
A minimap is displayed in the bottom-left corner of the canvas. It shows:
- A bird's-eye overview of all nodes and flows.
- A blue rectangle indicating the current viewport.
- Click anywhere on the minimap to navigate to that area.
- Click and drag on the minimap for continuous navigation.
Snap Grid
Enable Snap Grid in the Settings dropdown to activate a visible grid and snap node positions to a 20px grid. This helps create neatly aligned layouts.
Controls Reference
| Action | Input |
|---|---|
| Pan canvas | Click + drag on empty space |
| Zoom in / out | Mouse wheel, or + / − toolbar buttons |
| Fit to view | Toolbar Fit button |
| Select node or flow | Click |
| Multi-select | Ctrl + Click |
| Move node | Click + drag node |
| Move multi-selected | Drag any selected node (all move together) |
| Expand / Collapse | Double-click container node |
| Deselect all | Esc |
| Close DSL editor | Esc |
| Navigate via minimap | Click / drag on minimap |
Full DSL Example
Here's a comprehensive example combining all DSL features:
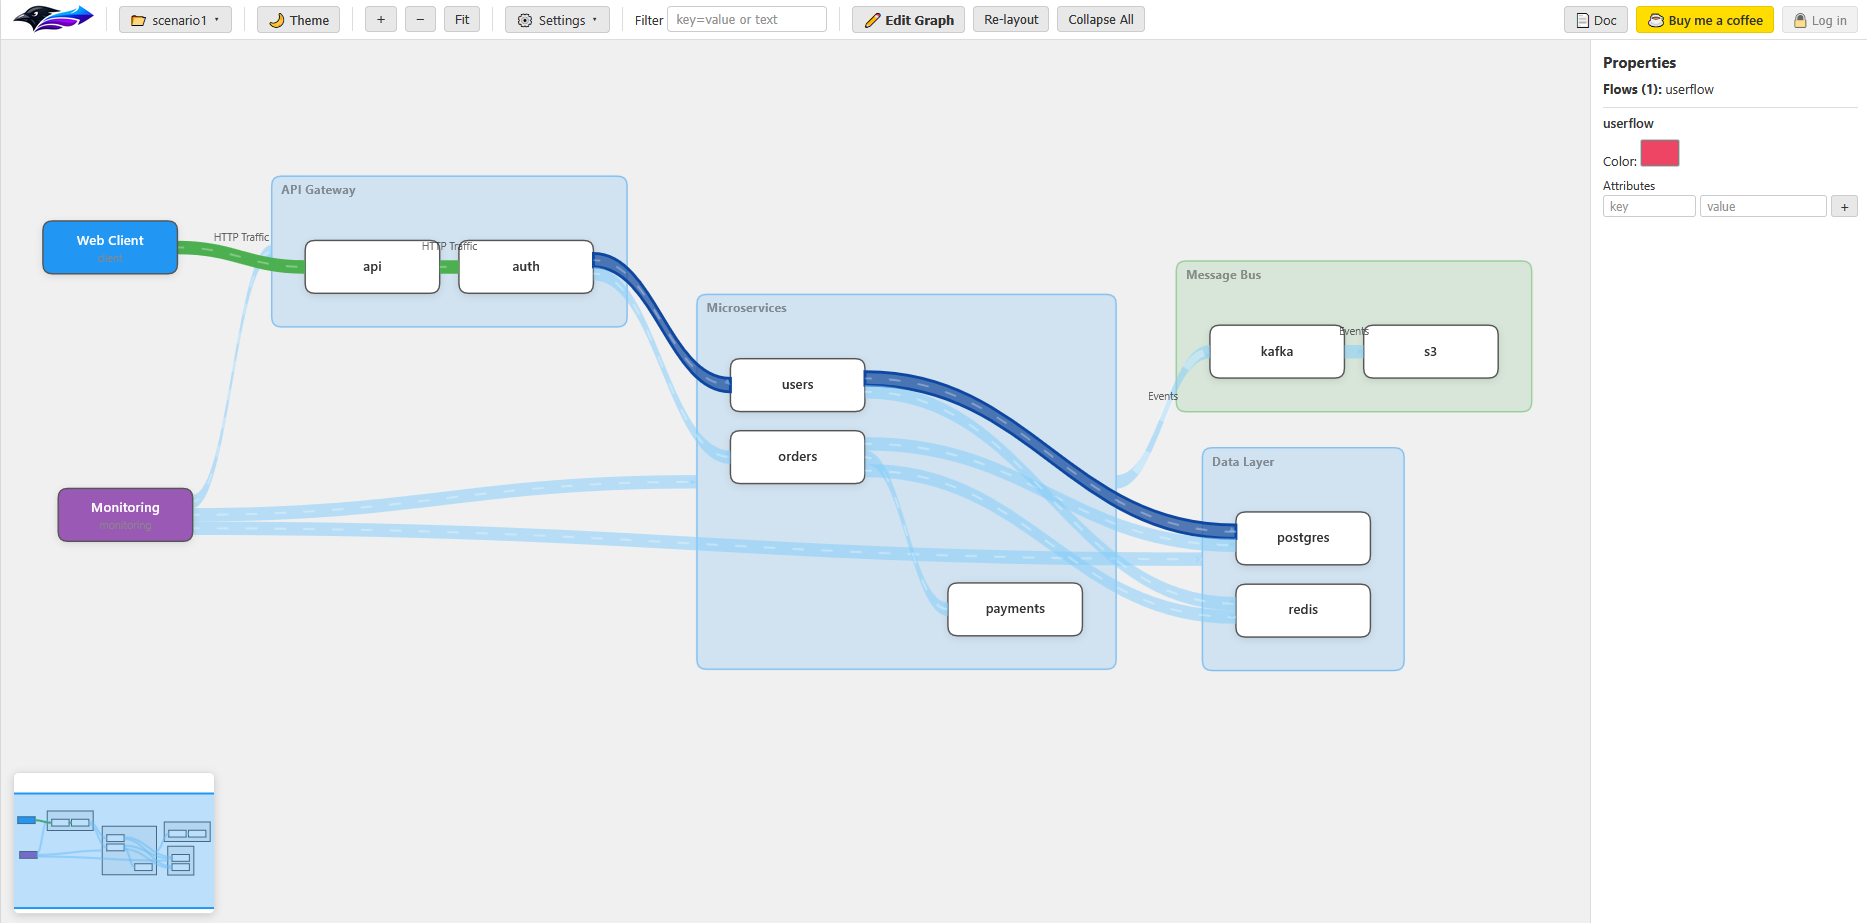
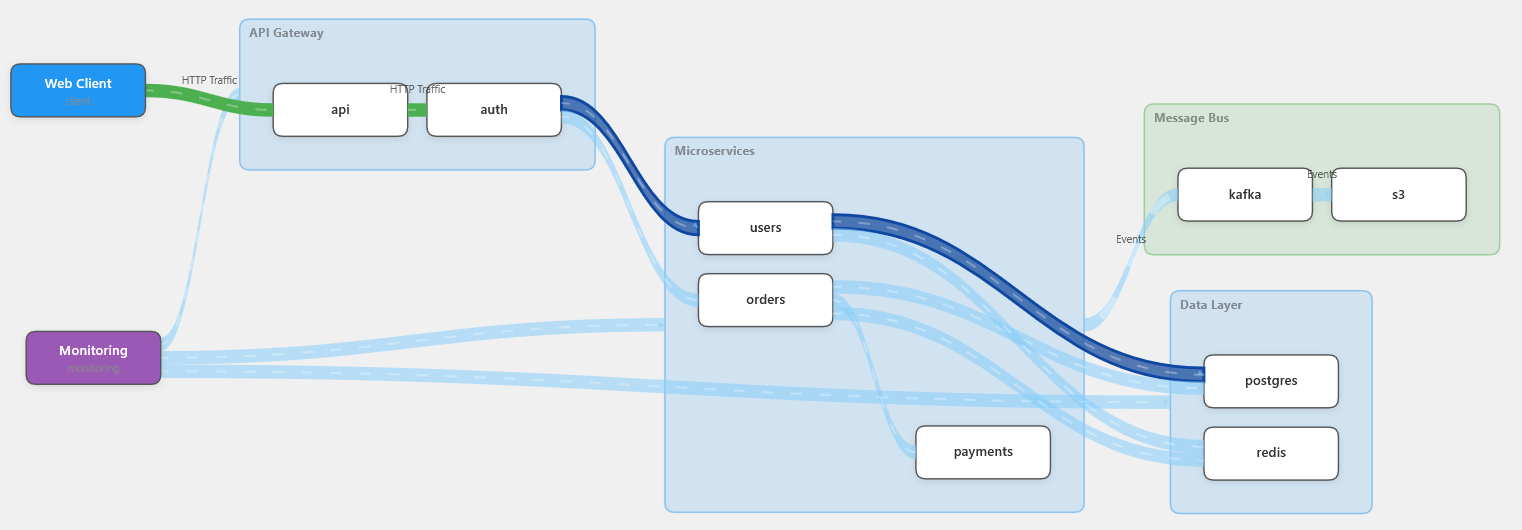
# ─── Hierarchy ───
API & Auth > Gateway
Users & Orders & Payments > Services
Postgres & Redis > DataLayer
Kafka & S3 > Messaging

# ─── Flows ───
Traffic{status=live, label="HTTP Traffic"}= Client --> API --> Auth

UserFlow= Auth --> Users --> Postgres
OrderFlow= Auth --> Orders --> Postgres
PayFlow= Orders --> Payments

_{mode=batch, label="Events"}= Services --> Kafka --> S3

Cache= Users & Orders --> Redis
Monitoring --> Gateway & Services & DataLayer

# ─── Node Attributes ───
Client{label="Web Client", status=live}
Gateway{label="API Gateway", status=live}
Services{label="Microservices", status=live}
DataLayer{label="Data Layer", status=live}
Messaging{label="Message Bus", status=inprogress}
Monitoring{label="Monitoring", color=9b59b6}
Status Colors Reference
Node Status Colors
| Status Value | Color | Hex |
|---|---|---|
live | Blue | #2196F3 |
inprogress | Green | #4CAF50 |
tostart | Amber | #FFC107 |
Flow Status Colors
| Status Value | Color | Hex |
|---|---|---|
live | Green | #4CAF50 |
inprogress | Yellow | #FFD54F |
tostart | Tan | #C8A96E |
Flow Modes
| Mode | Attribute | Animation Style | Use Case |
|---|---|---|---|
| Stream | (default — no mode attribute) |
Small moving dashes along center line | Real-time event streams, API calls |
| Batch | mode=batch |
Wide block segments filling the ribbon | ETL jobs, file transfers, batch processing |
# Streaming (default)
Live= SensorA --> Aggregator

# Batch processing
Nightly{mode=batch, label="Nightly Sync"}= DB --> Warehouse
Toolbar Reference
| Button / Control | Description |
|---|---|
| 📂 Scenario | Expandable dropdown for managing scenarios (new, rename, duplicate, delete). |
| 🌙 / ☀️ Theme | Toggle between light and dark color scheme. |
| + / − | Zoom in / out from center. |
| Fit | Zoom and pan to fit the entire graph in view. |
| ⚙️ Settings | Expandable dropdown: Snap Grid, Speed, Highlight Connections. |
| Filter | Text input to filter/highlight matching nodes and flows. |
| ✏️ Edit Graph | Opens the DSL modal editor for direct text editing. |
| Re-layout | Resets node positions to the automatic left-to-right layout. |
| Collapse All | Collapses all expanded container nodes. |
| 📄 Doc | Links to this documentation page. |
| ☕ Buy me a coffee | Support link. |
Hierarchy Flow Visualiser (Crow Flow) — Built with vanilla HTML, CSS & JavaScript. No external dependencies.
© 2025–2026